We have been fascinated with sea currents ever since we started kayaking, and putting Rick's PhD in physics to good use, we've been accumulating a body of data over the years. Although few go to this degree of detail, sea kayakers ought to have some basic understanding of the sea's movements, so let us present some of our results to you in case you might find them interesting.
我々は、カヤックを始めたからずっと、潮の流れの研究を行っています。砂と海水の入れたペットボトルを海に入れて、GPSでそのドリフトを登録して、特別な、自分で作ったソフトど地図に載せます。ソフトは、流れのベクターに潮時による色をつけます。こう言う風に、天草の海の複雑な動きを少しずつ分かるようになりました。
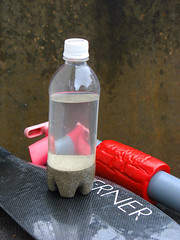
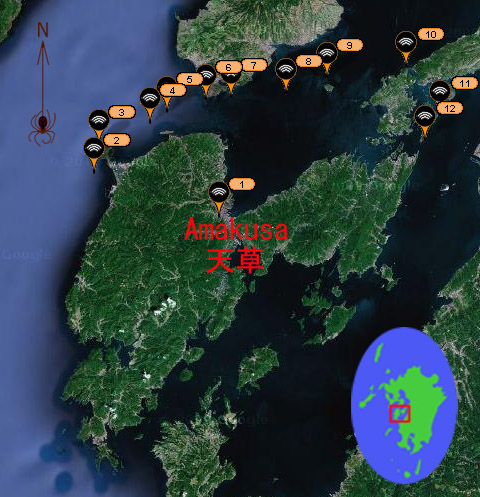
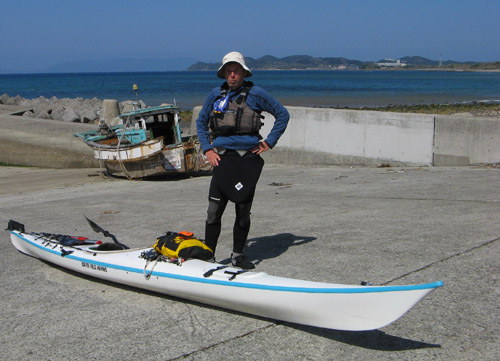
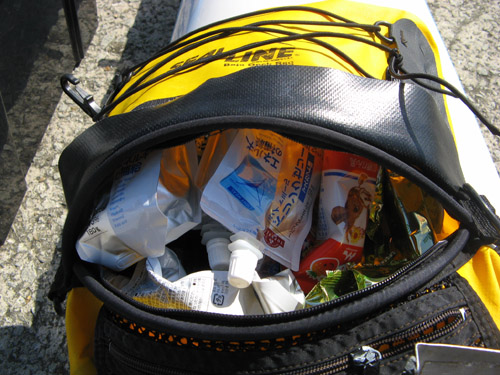
The Amakusa Islands, with their complex shorelines, seabed topography, and a network of interconnected straits, are a ready-made tidal current laboratory. While those familiar with the tides can generally deduce the likely flows by glancing at a seachart, in many areas of Amakusa this is just not possible; there are in fact places where the water flows in a direction opposite to what one might naively expect. To investigate further, we have made detailed current measurements, employing a simple but accurate method. We fill a plastic bottle with sand and enough seawater so that it just barely floats. Deploying this at a spot of interest, we record its drift using GPS for a short period of time. Unlike the kayak, the bottle is virtually unaffected by wind, yielding a highly accurate measurement of the surface current. The results are processed with dedicated software we designed, which plots color-coded vectors on a map. The color coding corresponds to the phase of the tide, making it easier to understand the changes in the current during the tide cycle. As the number of measurements grows, the map becomes cluttered but patterns begin to emerge.
For example, here is an area we have studied in some detail. It is located in Ushibuka at Amakusa's southern extremity, where the Nagashima Strait empties into the East China Sea. The tides of the inland sounds to the northeast combine with the tides of the ECS to the south and west, making it a kind of transition zone between the tidal estuary and the open sea. Additionally, the topography of the area is highly complex, with numerous bays and promontories, and several small islands and rocks located close to shore that create their own miniature straits where the water moves in a complex way. The islet and strait of Tsukino-shima pictured here is a perfect example. With a population of coral and many subtropical marine creatures, this tiny area is ecologically significant. The currents are important because they bring nutrient to the sealife, ensuring a vibrant ecosystem. This is the place we often bring friends in the summertime for some exciting snorkeling. The more casual tourist can enjoy the spectacle from a glass-bottomed boat that also plies these waters.
天草の最南端の牛深海岸へよく出かけるから、数年間にかけて潮流の軽量がかなり多くなりました。地図を見るとベクターが多すぎて見づらいけど、丁寧に見れば、流れの模式図が作れる。ここで表したのは、牛深海中公園の代表的の築ノ島の付近での上潮の流れです。
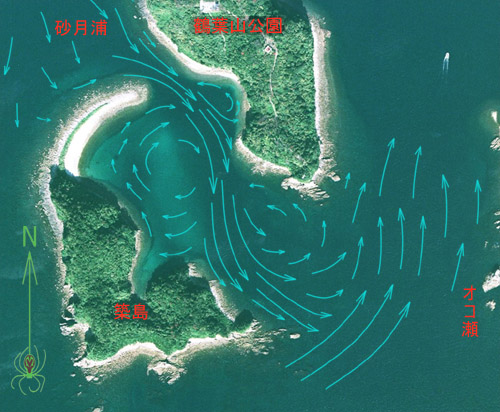
Carefully sifting through the above data, it is possible to make a schematic diagram of the currents. Although not as accurate as the original data, it has the advantage that the general flow can be appreciated at a glance. In this example, we mapped vicinity of Tsukinoshima at rising tide, when a fairly strong current flows from north to south in the narrow strait (although water flows from south to north everywhere else). Evident are at least three large-scale eddies within the strait, created as the main stream flows past promontories or bottlenecks. This is a natural behavior of flow that river kayakers are intimately familiar with. Physically, it can be understood as the Venturi principle: fast water moving past an obstacle tends to become turbulent at the edges with small eddies that drag in more water from the sides. Less obvious is the fact that as water accelerates, its level necessarily drops slightly. So the water from the sides flows downhill into a slight valley in the water level created by the stream itself. The eddy is completed when water from further back is dragged in to replace what has been drawn away. Note that in the middle of each eddy, the water is essentially stationary. Since the flow pictured is prevalent in this area, a sand bar (clearly visible in the overlaid aerial photo) has accumulated in the stagnant area on the left. The bar sits in about 4-5 meters of water, whereas the channel scoured by the current is 15-20 meters deep with very steep sides composed of large, stacked, coral-covered boulders and no sand.
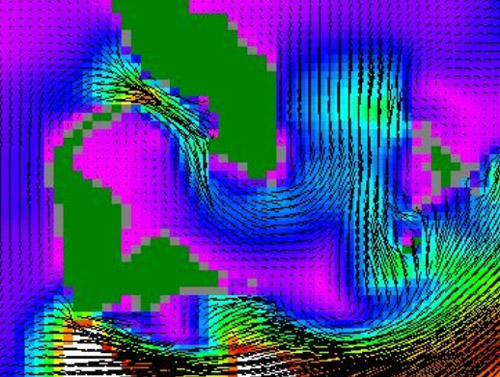
潮流をもっと詳しくしる為、コンピュータモデルを作りました。このモデルは、流体力学の方程式と自分の測定や海図による海底地形のデータをいれました。潮流のデータも入れると、モデルは、その海域の詳しい流れが計算できる。しかし、リアルのデータと比べると、ちょっと不正確ですね。この問題の複雑さの為です。モデルをまだまだ調整しなければなりません。
While making measurements is essential for understanding, it is also limited. We simply cannot make enough measurements everywhere and during every phase of the tide cycle. To further our understanding, we've constructed a computer model which can use the measured data points to generate a more detailed picture. This is done by programming the relevant fluid dynamics equations (or actually, approximations of them since the full equations are essentially unsolvable), constructing a detailed model of the shorelines and sea bottom (from our own surveys and the seacharts), breaking down this virtual seascape into small discrete cubes and letting the computer crunch through the equations. Pictured here is the result roughly corresponding to the data above. Clearly, the model is slightly deficient as differences between actual and modeled currents can be spotted at a glance. Fluid flow modeling is not a perfect science, and more adjustments will need to be done to the model to bring it into closer agreement with reality. We have our work cut out for us.
このデータは、牛深の月浦の付近で13kmのサーキットを漕いで14時間かけて連続的に計測しました。モデルのインプットの為、潮流の完全なサイクルのデータが必要だったですから。とにかく、このアニメーションをじっと見るとちょっと面白いだと思います。
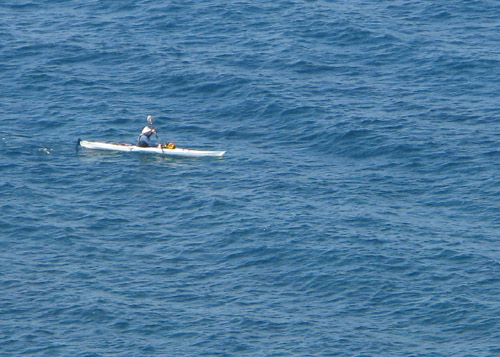
Here is the data used to 'feed' the computer model above. We gathered measurements painstakingly around the periphery of the study area by spending up to 14 hours at a time running the 13km circuit and constantly taking measurements over the entire tidal cycle. These data create the so-called 'boundary conditions' that ought to, in theory, determine the flow everywhere inside the area. Anyhow, we think it's interesting to just stare at for a while. The powerful influence of the Nagashima Strait is very obvious on the east side of the map, where the water moves more or less as one would expect, drawn to the north on rising tide and expelled to the south as the tide falls. The southwest side shows much more complex motion. Particularly interesting is the brief northward burst during the middle of ebb tide (yellow). We suspect this has to do with the interplay of estuary and ECS currents, but we'll have to investigate further to really know.
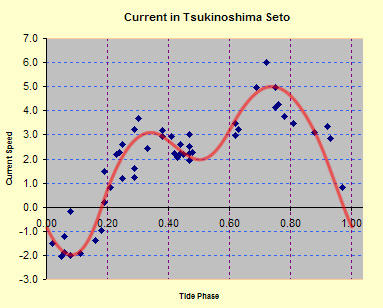
築ノ島の瀬戸の流れです。複雑な現象がいろいろ見れます。その流れは、満潮の時(位相=0)の短い間だけ北へ流れます。残りは、強い南への流れです。しかし、これも複雑でしょう。下げ潮と上潮は、二つのピークがあります。それで上潮のピークは一番強いで、5キロ以上の流れが出来ます。丁度干潮の時(位相=0.5)、流れはまだまだ南だけど、少し弱めてくろように見えます。
In the Tsukinoshima Strait, it is obvious that a southerly current dominates throughout most of the tide cycle. This pattern might be the influence of a much larger Venturi caused by the powerful Nagashima Strait current. When all the measurements we've done over the years in the strait are plotted (and corrected for the effect of spring and neap tides), an interesting pattern emerges. The water moves north (negative numbers) only for a short time at high tide (phase=0), and the south (positive) movement is also complicated by the presence of two peaks, the one during rising tide being stronger. The slight lull between these peaks falls more or less exactly on low tide (phase=0.5). Essentially, the strait flows in the same direction during both rising and falling tide. This highly complicated behavior has been relatively consistent over the years, as the spread of the plotted data points indicates. Many factors influence this unanticipated behavior. We can declare success in our research once we have a computer model that can predict this accurately.